Garonne · February 2026 · Earth observation
When the river
leaves its banks.
See through clouds. Follow the flood. Compare before concluding.
01 / 05
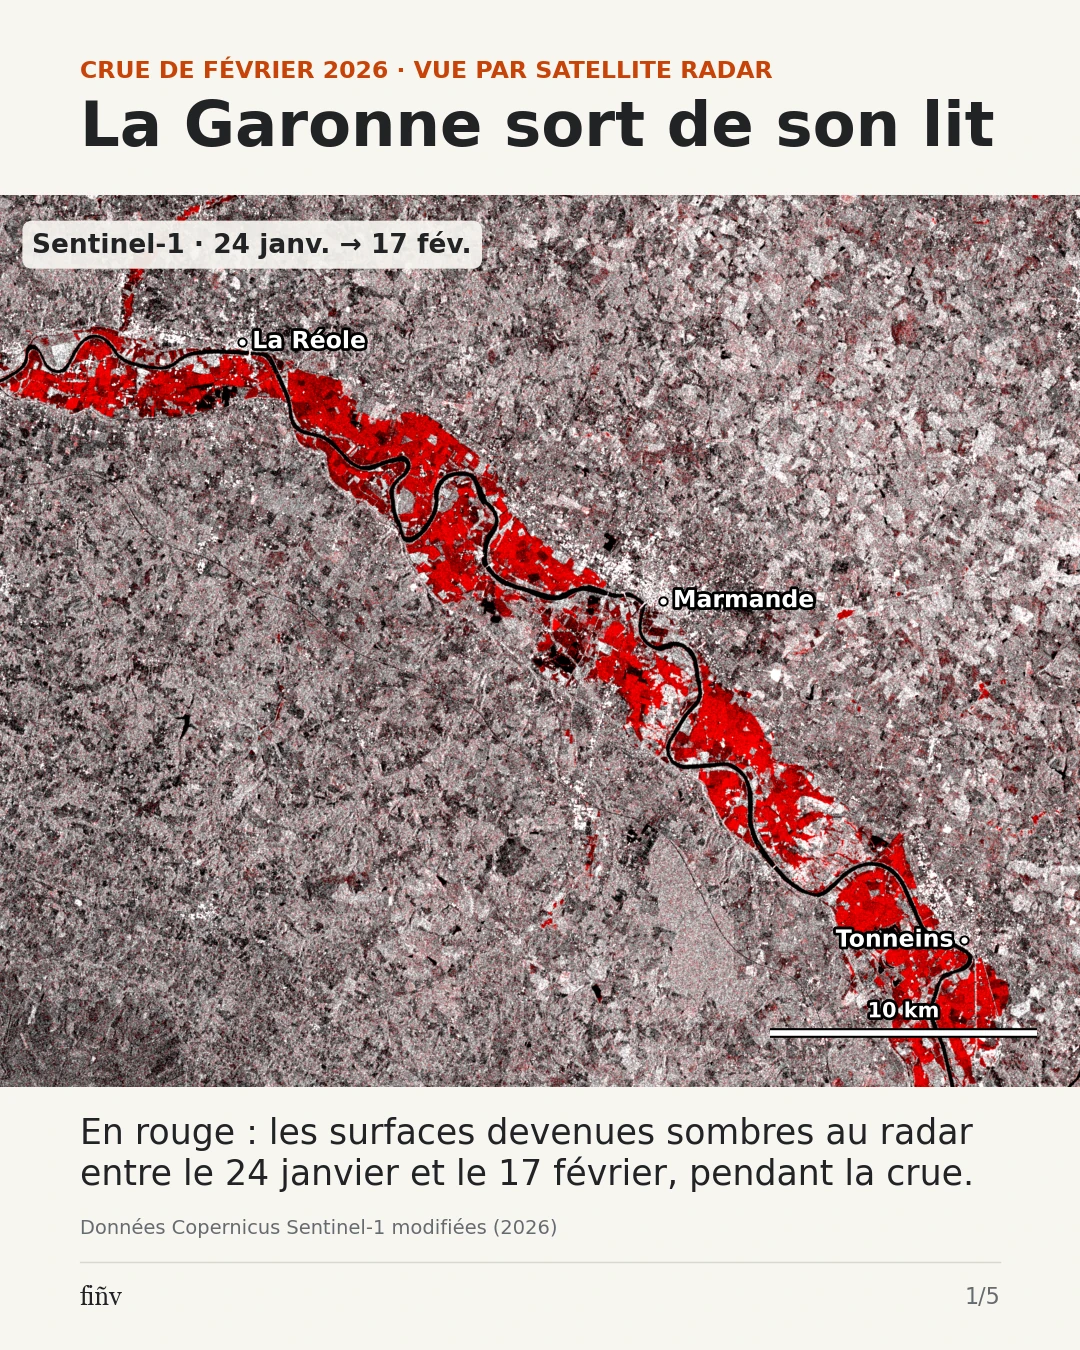
See the flood
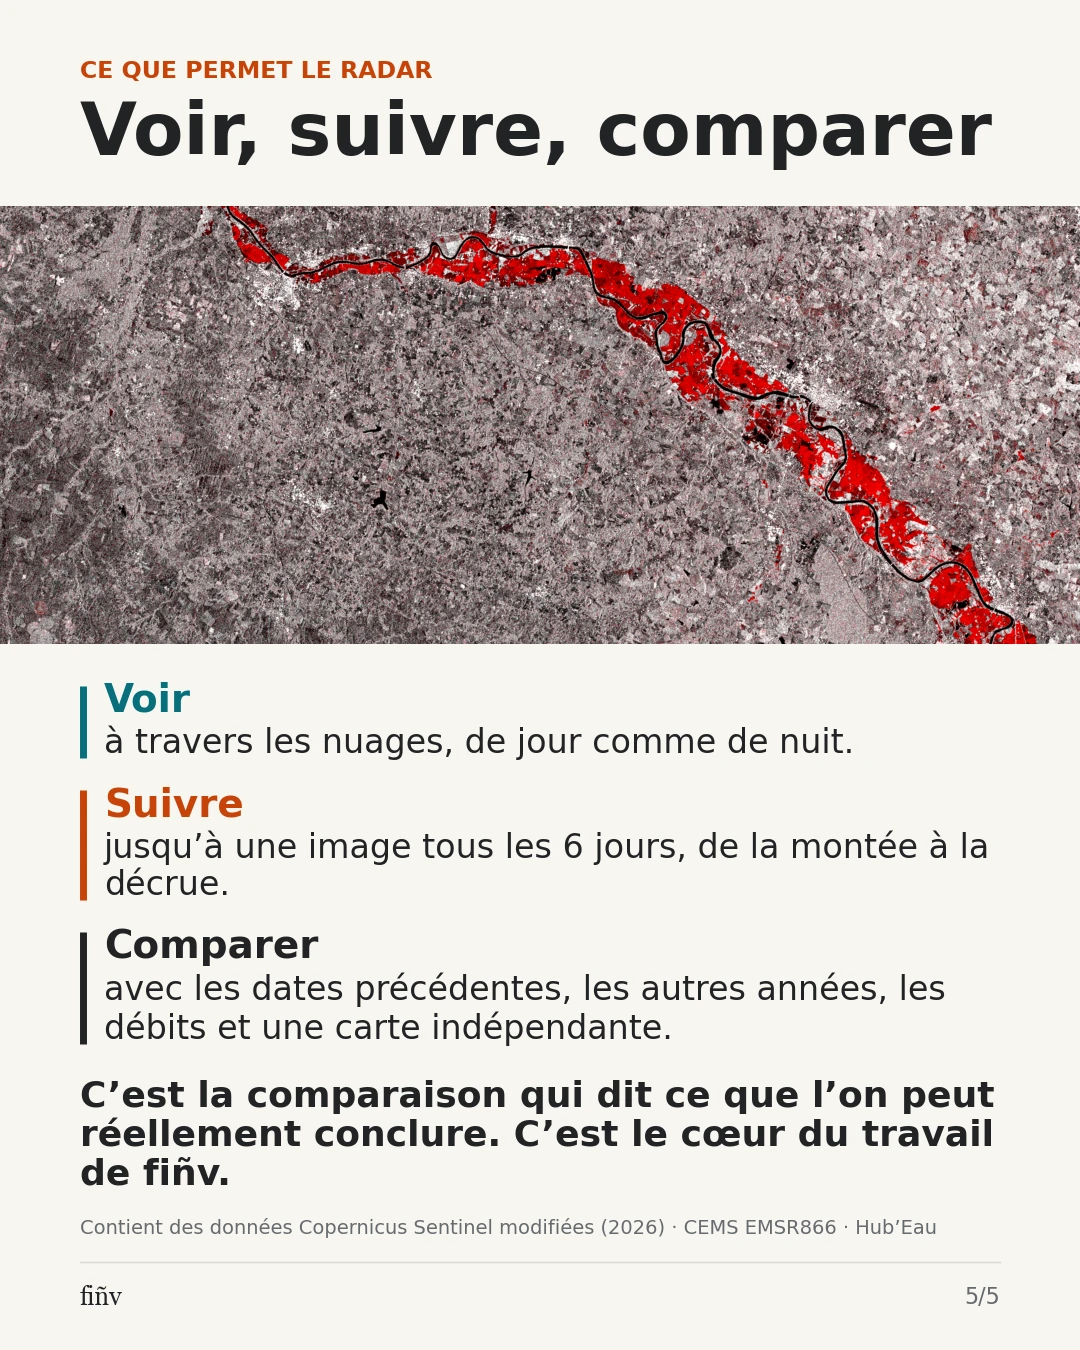
Red marks surfaces that became darker to radar between 24 January and 17 February 2026. These changes are consistent with the flood event; they are not a ground-validated flood boundary.
02 / 05
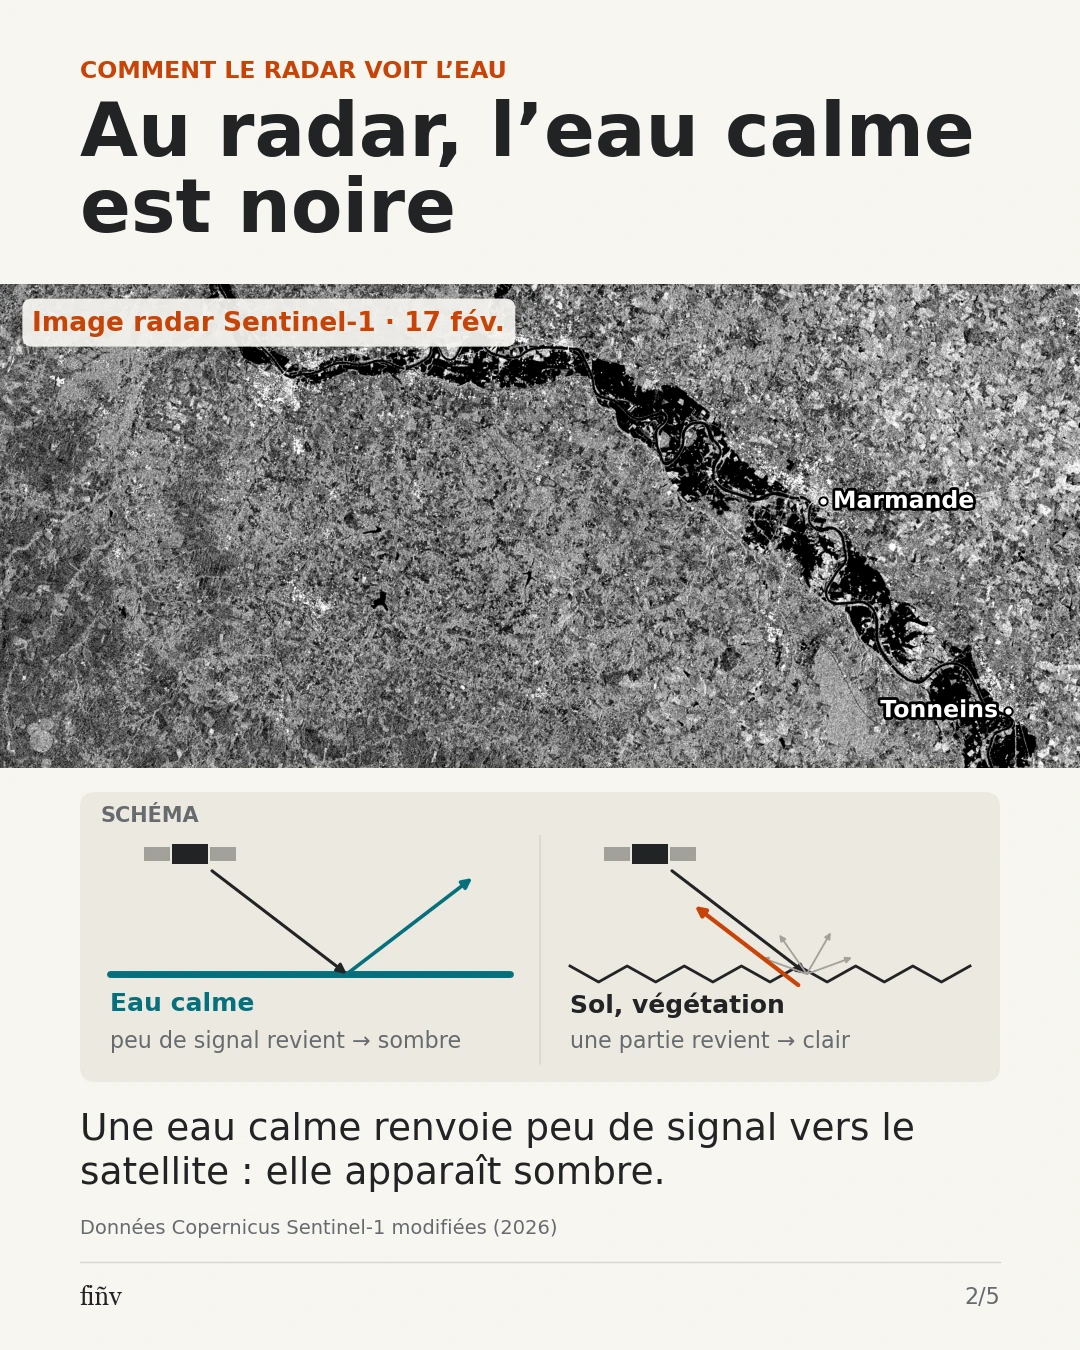
Read the radar signal
Calm water returns little signal to the satellite and appears dark. The reflection drawing is a labelled schematic. Wind, vegetation, buildings and soil conditions can alter the response.
03 / 05
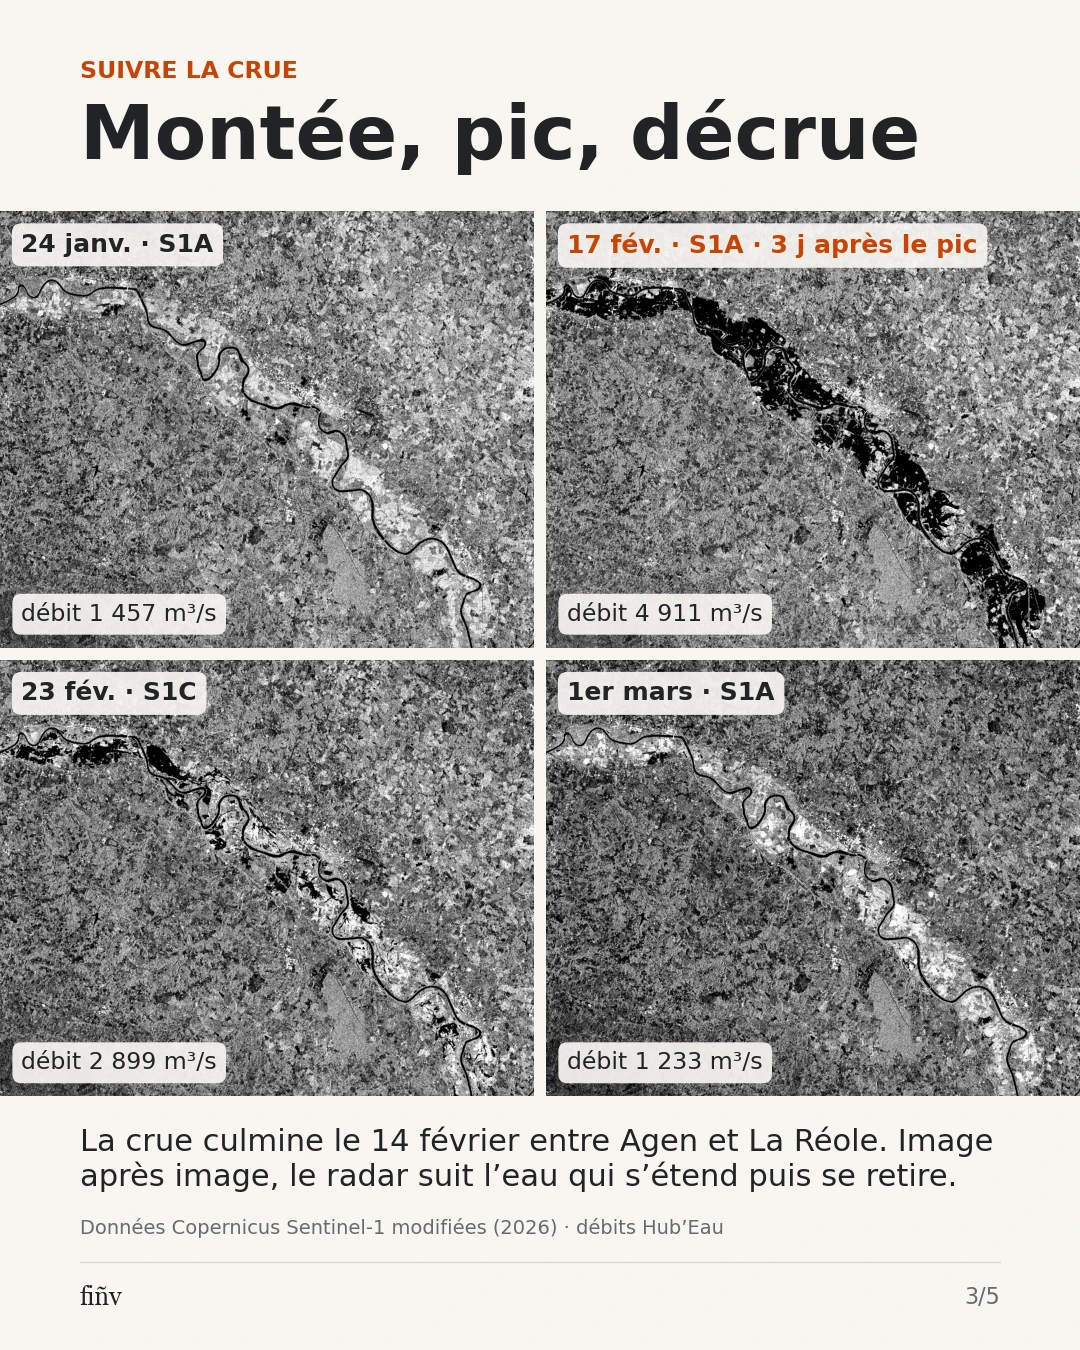
Follow the event
Radar observations are compared with measured river discharge. The 17 February acquisition occurred three days after the 14 February peak; it did not observe the peak itself.
04 / 05
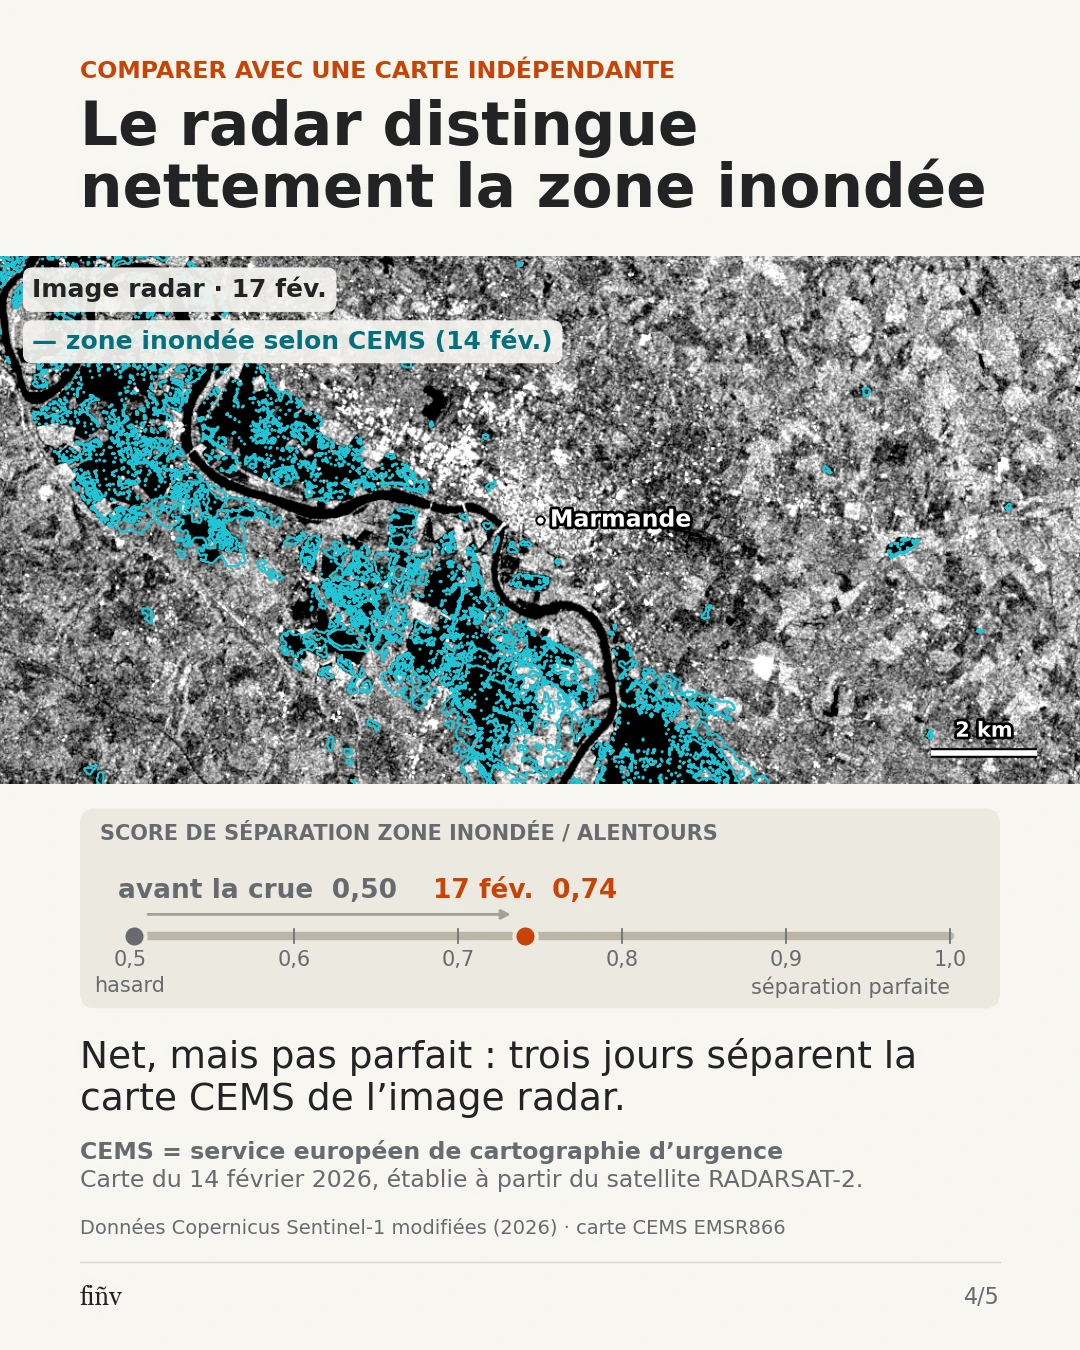
Compare with another satellite
The independent CEMS map comes from RADARSAT-2 on 14 February. Separation of CEMS-mapped sectors from their surroundings improves from 0.50 before the event to 0.74 on 17 February. This AUC score is not 74% agreement or accuracy. Spatial agreement remains partial.
05 / 05
What comparison makes possible
Other dates, previous years, river discharge and an external map give the radar signal its context. This is the basis for stating what is observed, what is consistent with the event, and what still needs to be demonstrated.
What is changing in your territory?
Discuss an Earth observation study ↗